About Harmographic Analysis and Harmography
Power Quality Expert have developed harmographic analysis to innovate and enhance the traditional analysis of electrical harmonics.
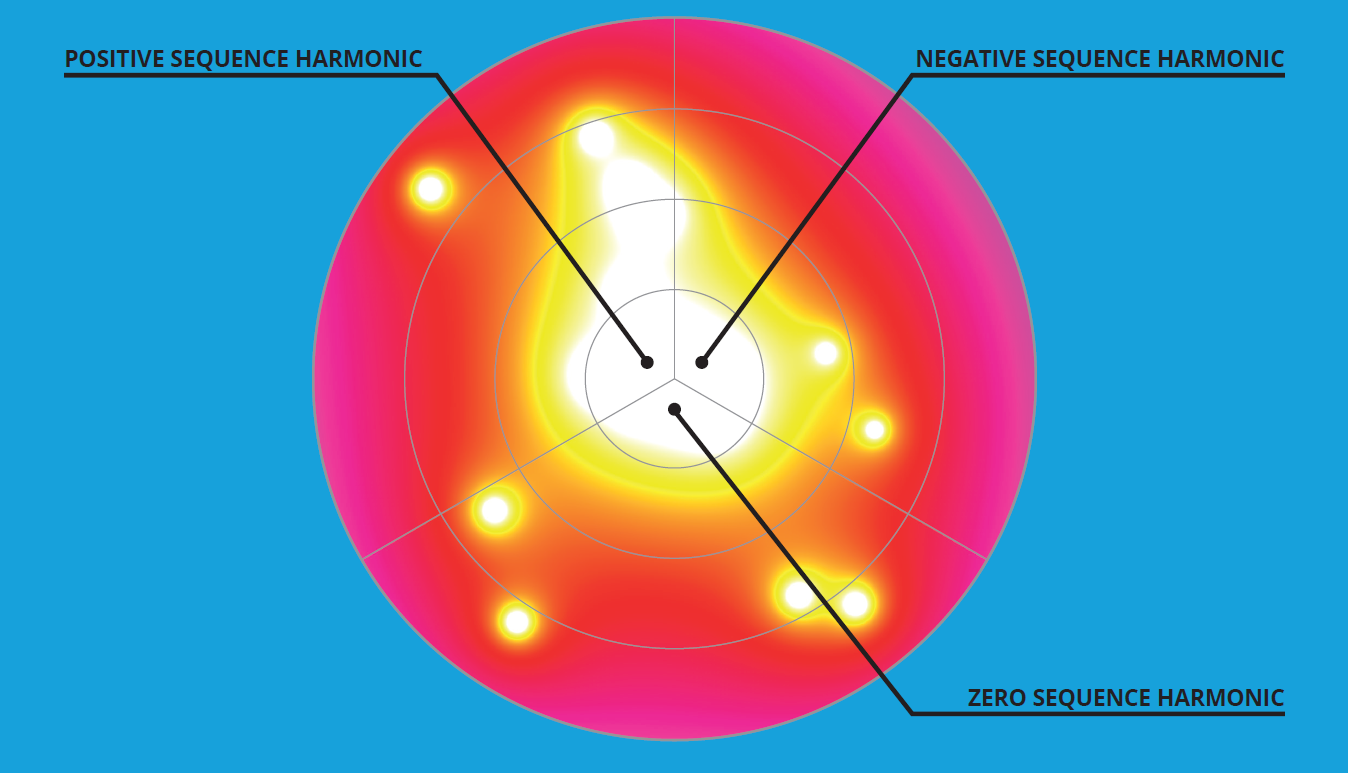
Harmographic analysis produces a unique visual “heat map” representation of an electrical systems harmonic profile. The harmographic map of the electrical harmonics is produced using our unique harmographic analysis algorithm which is used to process the traditional fast Fourier transform (FFT) measurements made by a power quality analyser.
The harmographic analysis algorithm can process power quality measurements from the commonly available power quality analysers that are used to carry out power quality surveys. We use the power quality measurements to visualise the harmonic data into separate positive, negative and zero sequence sectors of a phasor diagram. The “heat map” harmographic profile of the power quality and harmonic measurements forms a unique electrical frequency pattern allowing for simple visualisation of the harmonics present at an electrical installation.
This unique visual harmographic representation of the harmonic measurements gives an alternative view of the harmonic data from the traditional methods used. Harmographic analysis enables a more visually dynamic representation of the harmonic measurements which can help with client engagement and their understanding of how harmonics are present in their electrical installation.
The harmographic analysis technique can also be employed to process groups of harmonics or individual harmonic frequencies to produce a harmographic image specific to different types of connected loads or to visualise supply side harmonic compliance with unique visualisations of the harmonic components present in an electrical system.
When looking at harmonic mitigation and solutions, harmographic analysis can be used for both pre and post harmonic surveys to help identify the harmonic frequencies and distortion present. The harmographic maps can help highlight and present the before and after results in a more recognisable and engaging manor for engineers and clients, enabling them to review the effectiveness of the power quality solutions employed.
Harmographic analysis produces a unique visual map of an installations harmonic compliance

Positive, Negative and Zero sequence assessments can be made. Each with unique harmographic maps produced to enable quick identification of these subsets of harmonics.

The individual maps easily identify the effectiveness of harmonic mitigation solutions and can also be used to trend the electrical systems harmonic emissions and compliance.

